
TGP+ can easily be used to create reports for your company.
Since it runs exclusively in Excel, users have access to all the Excel features that make it such a staple for businesses.
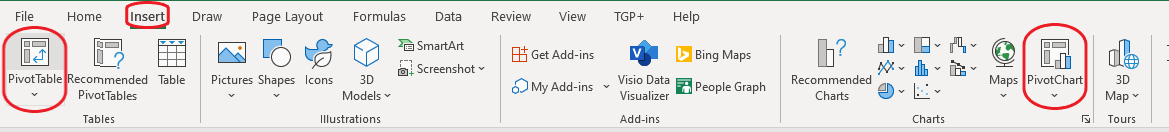
For example, Excel’s PivotTables are a great feature to use with TGP+. PivotTables provide an easy way to summarize or analyze company data. You can set them up to create reports using SmarterList data. The best part about PivotTables is that they have a built-in refresh feature. PivotTables and PivotCharts can be accessed from the Excel ribbon by clicking on Insert and finding the appropriate category.
Once your analysis, report, or graphic is set up, you don’t need to set it up again to perform the same analysis. For example, if you have GP reports you need to deliver to your supervisor every month, you can set up PivotTables to perform the analysis you need.
Once this is done, all you have to do every month is go into your SmarterList and refresh it.
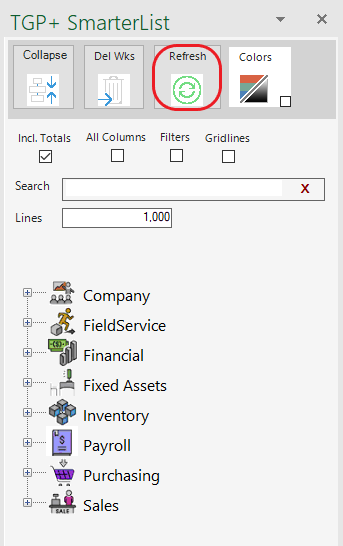
Then you can go to your PivotTable and do the same. Refreshing SmarterList will load the most up-to-date data on a company-wide level. Refreshing your PivotTable will load this data right into your analysis.
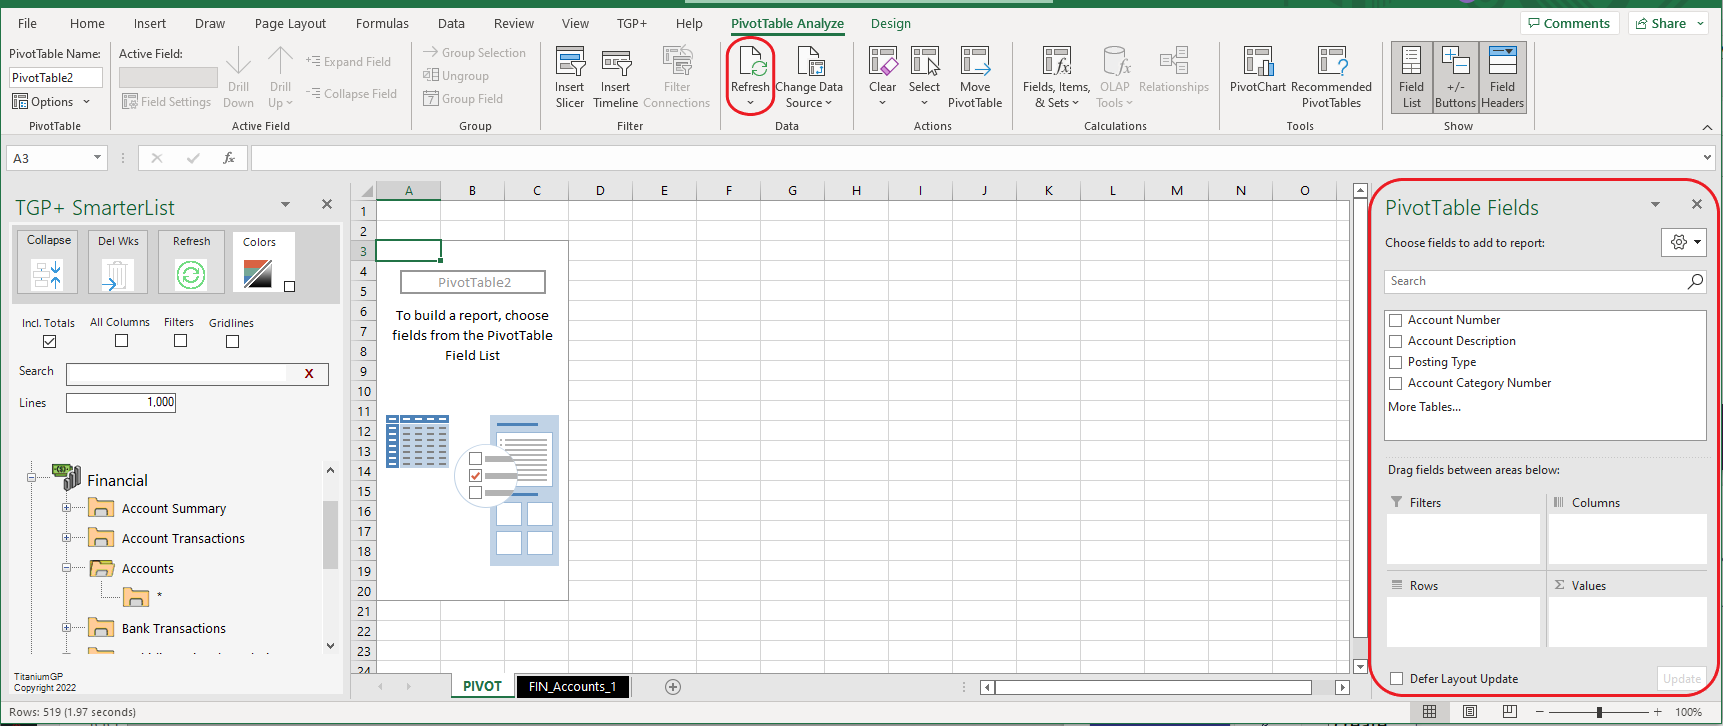
Once open, a PivotTable can be set up by adjusting the settings on the right-side vertical scroll bar. When you’re ready to refresh, you can do so by clicking on refresh in the Excel ribbon.
This is just one of the many ways TGP+ can facilitate creating GP reports.
If you have Microsoft Power Bi, for example, you can also create stunning visuals and graphics using TGP+ SmarterList data.
TGP+ is an amazing tool for enhancing and facilitating making your reports, especially when used in conjunction with some of the other powerful tools you have at your disposal.
Keep an eye on our social media for updates on changes coming to TitaniumGP. We hope to see you! Privacy Policy


